21 April 2011

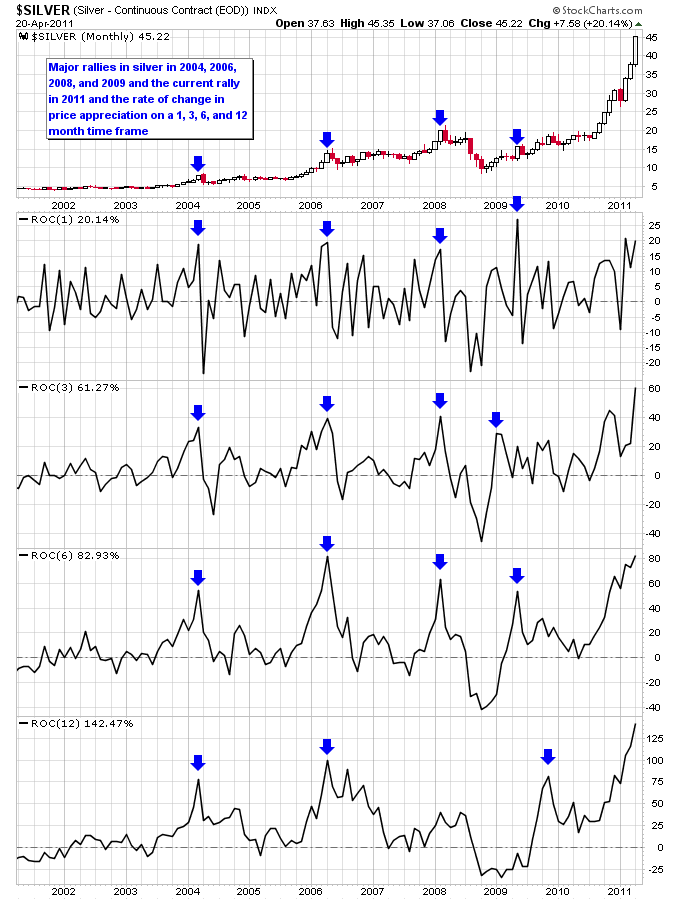
How does this current silver spike compare to the past? The next chart shows the major moves higher in silver during this bull market in 2004, 2006, 2008, 2009, and the current rally. Also shown is the rate of change in price appreciation on a 1-month, 3-month, 6-month, and 12-month time frame. Interestingly, the 1-month rate of change shows that at the end of each rally, silver had it's biggest monthly gain of the entire move. Right now silver is close to putting in its biggest monthly gain of this rally and has a week yet to go in April. Silver would have to gain more than 25% during this month though to eclipse it's biggest month to date which occurred in 2009. On a 3-month and 12-month time frame this is clearly the biggest gain of this silver bull to date, but on a 6-month time frame it is still in the same ballpark as the silver rally in 2006.

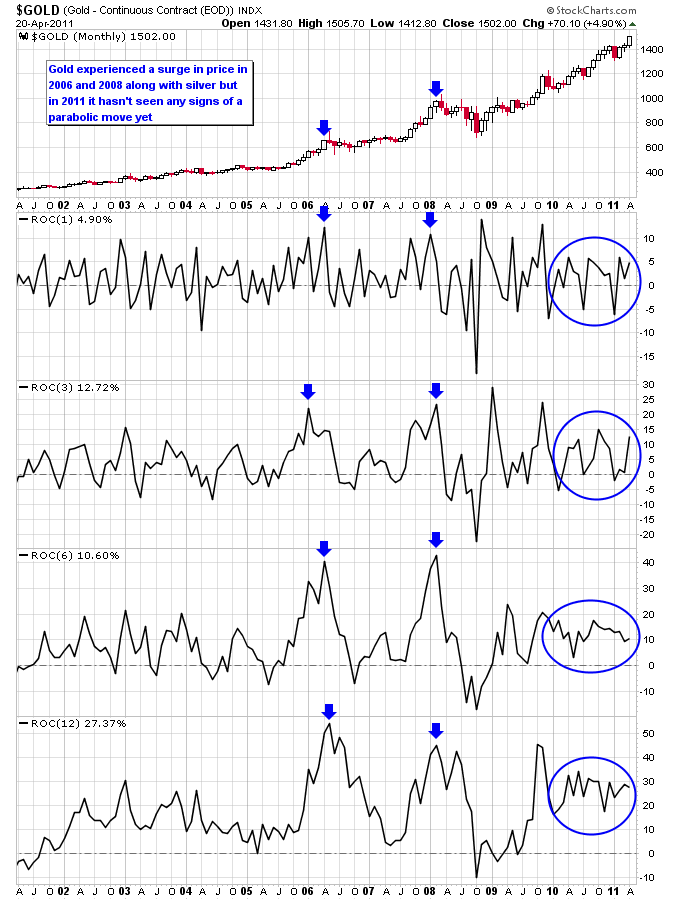
I noted in a recent article that we've still yet to see a big increase in speculation in the gold market along with silver. The next chart shows gold with the same rate of change indicators and you can see that in 2006 and 2008 gold started to go parabolic at the same time as silver. This time around though gold has been extremely tame given the huge increase in activity in the silver market. The last speculative period in gold actually occurred at the end of 2009.

When will this parabolic move in silver end? I've still yet seen a technique that is good at timing the end of an extreme move in a market, including oscillators and overbought indicators. In 2008 many people tried to call the bottom early only to see the market swoon to levels most people didn't believe was possible. Currently the opposite is happening in silver, where it is blowing through the overbought indicators that previously worked to call major tops in silver. In bull markets the surprises come to the upside, and that's really what is happening right now.
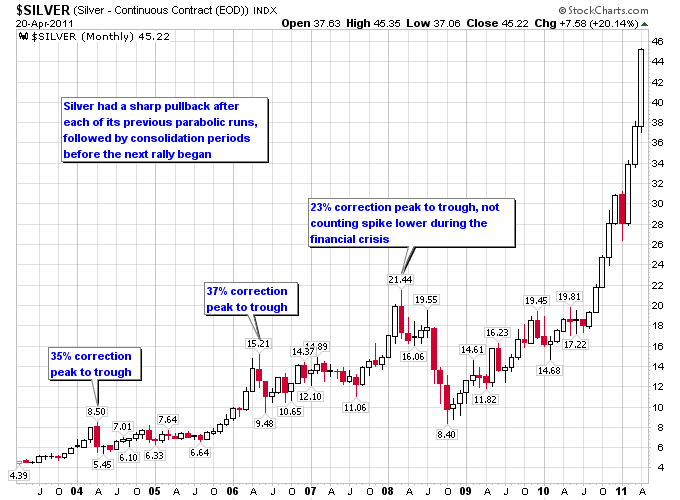
What is more certain is what will likely happen after this silver spike ends, which is a correction in silver followed by a consolidation period. The correction will get rid of excessively bullish sentiment in silver, and the consolidation will move investors' focus to other markets, which will prepare silver for its next bull move. The next chart shows the peak to trough corrections in silver following the rallies in 2004, 2006, and 2008. Notice how the corrections were over after a couple months, and then the consolidation period began. The only deviation from the pattern was in 2008 when the financial crisis pushed silver to an extreme low, and also expanded silver's consolidation period which provided the foundation for this current explosive silver rally.

Justin Smyth

No comments:
Post a Comment