From ZeroHedge.com
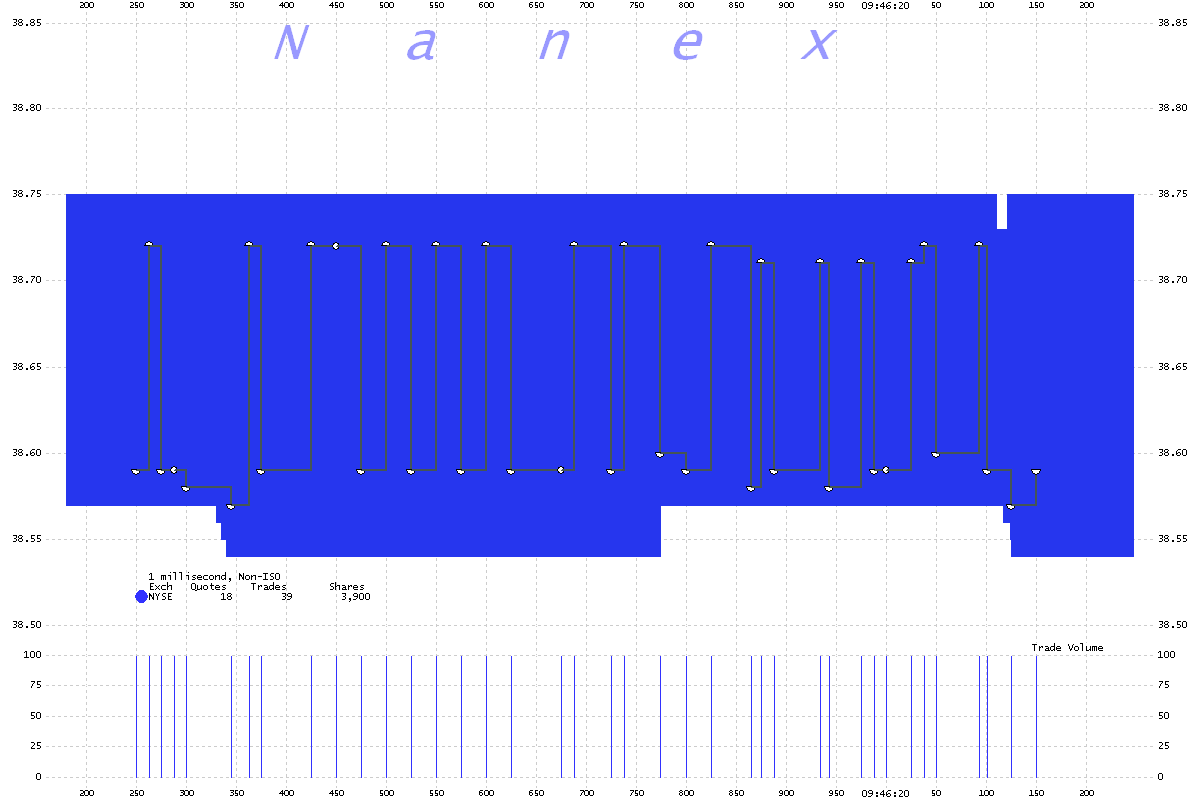
We all know something went horribly wrong in various NYSE-traded stocks today between 9:30 am and 10:15 am. So wrong in fact that the NYSE had to step in and cancel numerous trades in 6 symbols. However it did not DK millions of other trades in 134 other symbols, the vast majority of which we assume traded errantly due to the market making of Knight Capital (as admitted by the company), which today saw its biggest drop ever since going public on volume about 60 times greater than its average. We also all know that one should buy low and sell high. At least that is what human traders are taught, and that is what they attempt. Because if one consistently does the opposite, one will simply run out of money. Well, theopposite is precisely what the berserk algo in Knight's Market Making group may have done if Nanex, which has done a forensic analysis of one of the trades in question, is correct. In other words, instead of at least attempting to provide liquidity via limit trades, Knight's algorithm acted as a market order... gone horribly wrong. As the third chart below shows what the algo did with furious repetition and steadfast consistency was to buy at the offer, and sell at the bid, in other words buy high and sell low. Over and over and over and over. As Nanex laconically notes, "In the case of EXC, that means losing about 15 cents on every pair of trades. Do that 40 times a second, 2400 times a minute, and you now have a system that's very efficient at burning money." Which also means that by not DK'ing several hundred million prints, the NYSE may have just thrown Knight under the bus, because the market maker is suddenly on the hook for tens if not hundreds of millions in inverse market making profits.
Here we will assume that readers are sufficiently familiar with market structure to know that market makers only participate in the market in order to collect liquidity rebates, i.e., to be the limit on the bid which is hit, or the offer which is lifted. What Knight did was effectively the opposite, and it also collected the opposite of a rebate: i.e., it paid someone else for no reason at all... well technically to withdraw liquidity. However liquidity that led to creation of losses not profits.
Naturally, when the entire logic of trading was perverted courtesy of Knight's busted algo, everything went Bizarro Day, and stocks went higher, because they went higher, and the higher they went, the greater the incentive for the algo to keep pushing the stock higher. This explains not only the volume surge, but also the shocking price moves in some stocks such as China Cord Blood which exploded several hundred percent higher before someone had to finally step in. And what is most notable is that because there were neither fat finger trades, nor busted algos that took out the entire bid or offer stack in one trade, thus triggering circuit breakers, but a slow methodical bleed, there was no reason under the current SEC order cancellation methodology to bail out Knight and its berserk algorithm.
Simply said: today may be the single worst day in Knight's market making history. And sadly, as the NYSE already noted minutes before the market close, the decision to not cancel any more trades is "not subject to appeal."
From Nanex:
What really happened, or how to lose a ton of money, fast.
What follows should strike you as crazy. If it doesn't, read it again, because it is.
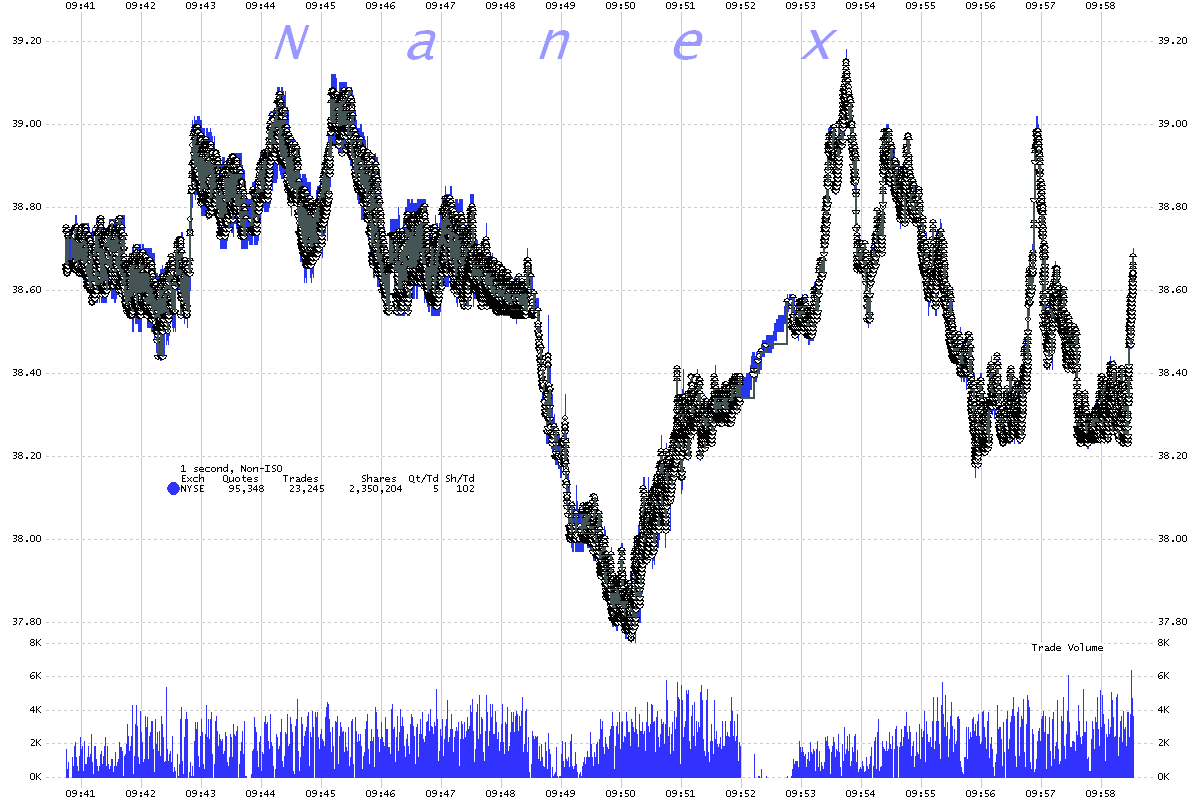
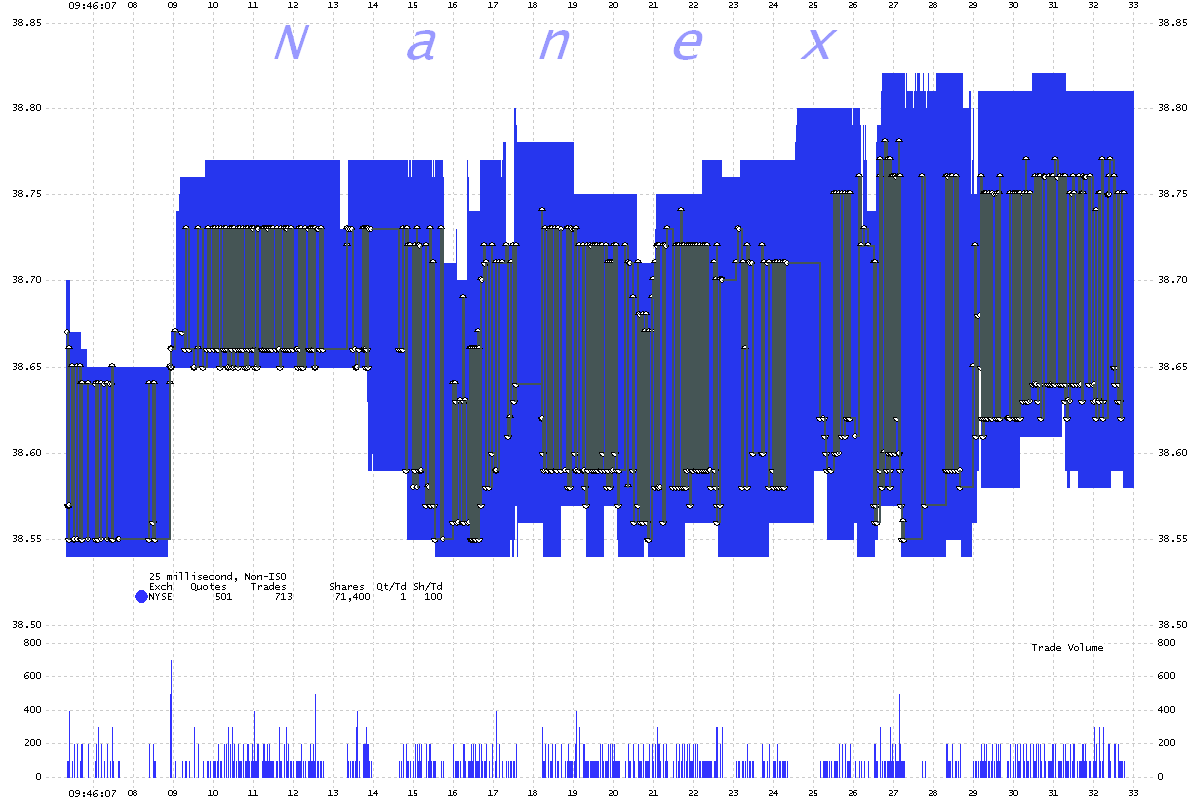
The following 3 charts plot non-ISO trades (regular trade condition) reported from NYSE in the stock of Exelon Corporation (symbol EXC). By plotting and connecting only regular trades from NYSE we get a clearer picture of the nature (some might say horror) of this event.
1. EXC One second interval chart. Circles are trades, the blue coloring is the NYSE bid and ask which is mostly covered by gray lines that connect the trades.
2. Zoom of above chart showing about 27 seconds of data. Now the gray lines connecting trades are more clearly visible. NYSE's bid/ask is the blue shaded area (the bid price is the bottom of the shading, and the ask is the top).
3. Zooming in to a 1 millisecond interval chart, we can see one second of data which shows 39 trades.
Note how the trade executions ping pong from bid to ask. As if someone is buying at the offer, then 10 ms later selling at the bid, and so forth. It turns out, the gray shading you see in the first chart of EXC is from this alternating between buying and selling. That's right, almost all these trades alternate between buying at the offer and selling at the bid, which means losing the difference in price. In the case of EXC, that means losing about 15 cents on every pair of trades. Do that 40 times a second, 2400 times a minute, and you now have a system that's very efficient at burning money.
WED 01 AUG 12 | 11:40 AM ET
CNBC's Bob Pisani and Art Cashin, of UBS, discuss unusual trading volume of a handful of stocks this morning at the NYSE.


No comments:
Post a Comment