Peter Degraaf
4 October 2010
4 October 2010

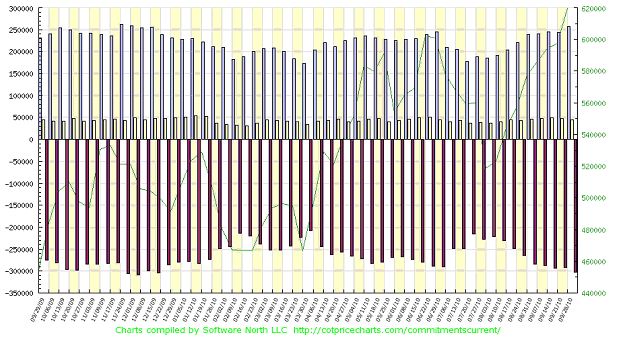
At the present time the price of gold does not seem to be intimidated by the large COT "net short' number, as in the past. Could it be that the hedge fund operators and large investors sense a possibility that the commercials are 'on the ropes'? Some of these commercial traders have carried a large short position for many months. All of these short positions are now 'under water'. Every time gold rises, the holders of short positions have to raise margin money or buy back a losing position. The upward pressure on price is due to fundamentals for gold that are extremely bullish and these include:
- The US money supply is today twice as large as it was just a few years ago.
- The Obama administration is without a clear economic policy - three out of four members of the economic team have just resigned - and the fourth, Tim Geithner, has never held a position in the business world aside from being involved in the banking business at Goldman Sachs. The man can't even keep correct personal income records.
- Worldwide money supply is expanding at an average rate of 10%.
- The US dollar is in a long-term decline against gold (see chart below).
- The Euro is in a long-term decline when measured in gold (see chart below).
- Gold is rising not only in US dollar terms but also as expressed in a number of currencies - this reflects a 'flight to safety from fiat currencies.'
- Gold production is declining, despite higher prices.
- It takes longer (due to regulations) to build a gold mine than ever before, and the rising cost of materials and fuel makes it very expensive to build a mine.
- The period between US Labor Day and Christmas is usually the most gold-bullish period of the year. In seven of the last eight years gold rose during this period.
- The expiration of options on August 26th did not have a negative effect on the gold price, compared to options expiration days in June and July. This proves strong underlying physical demand.
- China is buying up local gold production, thus withholding it from the market.
- Russia is buying up local gold production, thus withholding it from the market.
- Gold ETFs are more popular than ever before, drawing bullion away from the market.
- The US gold supply that is stored at Fort Knox has not been audited since 1953 and is most likely all or partly gone. It has either been sold or leased.
- Central banks have stopped selling gold and some have become buyers.
- Gold thrives when 'real interest rates" (US T-bill rate less CPI) is negative - as now. (People who are earning less than 7% per year on an investment are actually going backwards because of the inflationary effect which is currently 7% and rising!) Gold on the other hand has been rising at an average +20% per year for the past five years. Since 2001 gold has risen 400%!
- Gold thrives during periods of price inflation and we are witnessing the beginning of increased price inflation: Wheat, corn, oats, barley, oranges, cattle, hogs, salmon, copper, iron ore, cotton, sugar, coffee, palm oil, health care, education are just some of the categories that are rising in price.
- read on

No comments:
Post a Comment